

Introduction
There is a near consensus among academics and businesspersons that the Business Confidence Index (BCI) provides information about future investment growth due to its predictive ability and superior forecasting power. The index serves as an early warning indicator for the state of the economy, helping policymakers predict economic expansions, contractions, and turning points. Effectively, policymakers may project economic growth, economic stagnation, and, to some extent, economic recessions or crises with a reasonable degree of accuracy.
The Durban BCI is computed from quarterly survey data on business conditions and expectations. The index is based on responses provided by business executives and entrepreneurs in the greater eThekwini Municipality. This report presents the Durban BCI for the second quarter of 2026. The index ranges from 0 to 100, where a score below 50 indicates a lack of confidence in the Durban economy, 50 indicates a neutral business situation, and a score above 50 indicates confidence in the economy.
The Durban BCI
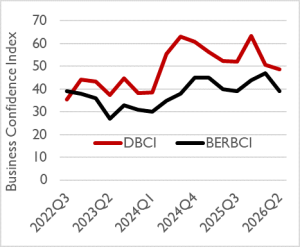
The Durban Business Confidence Index (DBCI) slipped for a second consecutive time in 2026Q2. It dropped from 50.63 in the first quarter of 2026 to 48.82 in 2026Q2. This represents a 3.57% quarter-on-quarter (Q-o-Q) decline in confidence in the quarter under review. For the first time since 2024Q2, the index has fallen below the neutral zone, indicating a lack of confidence in Durban’s economic prospects. Compared to the same quarter of 2025, business confidence in Durban fell by 6.83% in 2026Q2, suggesting that businesses believe conditions are worse this year than they were a year ago.
The magnitude of this downturn could have been far more severe. The overall decline in the BCI was cushioned by sectors that registered tangible improvements in their business confidence indices, thereby preventing a steeper erosion of business sentiment. These resilient pockets provided a vital counterbalance to the broader pessimism, ensuring that the index did not sink substantially deeper below the neutral zone.
Notwithstanding this decline, the DBCI remains firmly above the national business confidence index. The national index constructed by the Bureau of Economic Research (BER) dropped by 8 index points to 39 in the second quarter of 2026 (see Figure 1). This suggests that the drop in Durban’s business confidence is largely driven by nationwide factors, including changes in the expected path of inflation and interest rates, geopolitical tensions, higher fuel prices, and migration-linked protests.
Figure 1: Business Confidence in Durban and South Africa
Source: Durban BCI technical team and BER
The overall index, as discussed above, masks substantial differences across sectors. Some sectors, such as ‘manufacturing’, ‘construction’, and ‘community, social, and personal services’, among others, recorded significant declines, while others recorded notable gains in business confidence.
The Community, social, and personal services index, for example, recorded a 19.83% decline in the present quarter compared to the previous quarter of 2026, falling from 50.59 in 2026Q1 to 40.56 in 2026Q2. The transport sector, which is among the most susceptible to rising fuel prices, reported a 4.19% decline in the second quarter of 2026. Business confidence in this sector declined from 58.53 index points in 2026Q1 to 56.08 in 2026Q2, representing a 4.19% decline Q-o-Q. Year-on-year (Y-o-Y), business confidence in the sector fell by nearly 10%. This largely reflects the heightening geopolitical tensions and their impact on fuel costs.
The manufacturing sector’s index, arguably the most essential sector for employment creation, shrank by 7% in 2026Q2 compared to the first quarter of 2026. As in other sectors, this decline reflects higher production costs driven by high fuel prices, among other factors. Notwithstanding this, the manufacturing sector showed signs of improvement compared with 2025Q2, suggesting that business conditions are far better than a year ago. More specifically, business confidence in the sector improved by 13.87% in the present quarter compared to the same period in 2025.
Agriculture, hunting, forestry & fishing lost about 10% in business confidence in 2026Q2 Q-o-Q. Rising fertilizer prices and adverse weather conditions are significant drivers of the decline in this sector’s business confidence. Confidence in the construction sector continues to dip. It dropped by nearly 20% in 2026Q2, Q-o-Q. The Y-o-Y picture is even bleaker. Compared to 2025Q2, business sentiment in the sector plunged by 41% in 2026Q2, suggesting worsening conditions with no signs of recovery in the short- to medium-term.
The financial intermediation, insurance, real estate, and business services sector, on the other hand, registered significant improvements in business confidence. The business index for the sector rose to 55.55 from 39.23 index points, representing a 41.6% improvement on a Q-o-Q basis. Wholesale & retail; repair of motor vehicles, motorcycles, personal & household goods; catering & accommodation also registered a slight improvement from 46.18 to 46.46 index points, Q-o-Q. Furthermore, business confidence in the electricity, gas, and water supply sector also improved Q-o-Q, rising to 55.87 index points in 2026Q2 from 39.82 in the previous quarter.
In conclusion, the Durban Business Confidence Index (DBCI) declined substantially from 50.63 in 2026Q1 to 48.82 in 2026Q2. This shows that the index has dropped below the neutral zone, although it remains above the national index. We conclude that factors beyond the city level largely drove the drop in business confidence. These reflect the escalating, volatile geopolitical tensions and the ongoing immigration protests.
Service Delivery
While service delivery remains a challenge in Durban, the proportion of respondents who reported that, if they (or anyone) complained about poor service delivery, it is unlikely that the local municipality would address it within a reasonable time frame dropped to 71.2% in 2026Q2, from 77.4% in 2026Q1.
In the 2026Q2 survey of business opinion in Durban, respondents cited roads as the worst service provided by the authorities (31.5%), followed by environmental management (sewerage, solid waste, and parks) (27.4%), water supply (26%), and public safety (police, fire, and ambulance) (13.7%), in that order. Electricity remains the least of the service delivery concerns faced by the survey respondents (1.4%). Following the suspension of loadshedding in March 2024, and with winter midway through, it is highly likely that power supply will continue uninterrupted, everything else remaining the same.
Review of Selected Macroeconomic Indicators
Real GDP
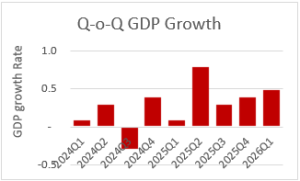
South Africa’s real GDP growth rose Q-o-Q for the second consecutive quarter to 0.5% in 2026Q1 from 0.4% in 2025Q4 and 0.3% in the previous quarter (2025Q3) (see Figure 2). This gradual quarterly acceleration in the country’s real output growth points to a broadening of domestic economic activity, driven by improved performance in finance, real estate, and business services (0.9%), agriculture (3.9%), trade (0.7%), and transport (0.7%) sectors. Y-o-Y, the country’s real GDP increased significantly from 0.8% in 2025Q4 to 1.9% in 2026Q1. The sharp Y‑o‑Y jump in the country’s real output growth is largely attributable to a favorable base effect, as 2025Q1 was notably weak.
Inflation and interest rates
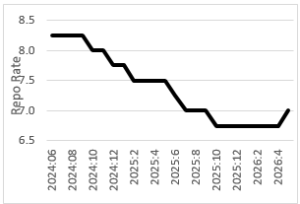
The Monetary Policy Committee (MPC) of the South African Reserve Bank (SARB) raised the REPO rate from 6.75% to 7% on 28 May 2026 (see Figure 3). This was the first time the SARB increased the REPO rate since May 2023, when it was raised from 7.75% to 8.25% on 25 May 2023. The recent hike was implemented to counter accelerating price pressures, as both actual inflation and inflation expectations have been rising, thereby breaching the SARB’s current target band of 2 – 4 % (3% plus or minus a 1 percentage point tolerance).
In the Survey of Business Opinion in Durban for the second quarter of 2026, 58.9% of the respondents reported that they expect interest rates to increase in the third quarter of the year (compared to 58.1% of respondents in the previous quarter’s survey, who expected interest rates to rise in 2026Q2). These expectations, in turn, may have been driven by expectations of rising inflation. In the 2026Q2 survey, 65.8% of respondents expect inflation to rise in the third quarter of 2026 (compared with 75.8% in the previous quarter’s survey who expected inflation to increase in 2026Q2).
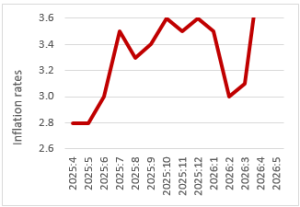
Indeed, the national inflation rate as measured by Y-o-Y percentage changes in the all-items national composite consumer price index (CPI) rose as expected for the third consecutive month to 4.5% in May from 4% in April, 3.1% in March, and 3% in February 2026 (see Figure 4). A breakdown of the basket of commodities used to measure CPI shows that inflation in May 2026 was primarily driven by the transportation sector (9.4% in May compared to 4.9% in April) and the housing and utilities sector (5.3% in May compared to 5.2% in April). The sharp increase in transport inflation reflects higher global crude oil prices, while the modest increase in housing and utilities reflects the recent electricity tariff increases as implemented by Eskom.
Exchange Rates
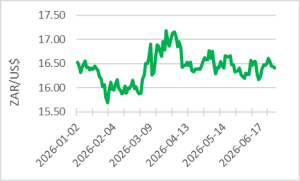
The United States dollar (US$) lost 4.19% against the South African rand in the second quarter of 2026, moving up from R17.0943/US$ at the end of 2026Q1 to R16.4072/US$ at the end of 2026Q2 (see Figure 5). The rand’s appreciation against the dollar was likely a consequence of the SARB’s interest rate hike, which widened the yield differential in favour of rand-denominated assets and thereby attracted foreign portfolio inflows, and the US dollar’s generally poor performance on global markets.
During the same period, the rand gained 4.01% against the British Pound Sterling (GBP), up from R22.5781/GBP at the end of 2026Q1 to R21.7075 at the end of 2026Q2. The local currency also gained 4.88% against the Euro, up from R19.6054/Euro at the end of 2026Q1 to R18.6927/Euro at the end of 2026Q2. The broad‑based strengthening of the rand against the Pound Sterling and the Euro mirrored the same positive carry‑trade dynamics following the local interest rate hike, coupled with relative weakness in the British and Eurozone economies amid their own softer growth outlooks, making the rand more attractive against these major trading currencies.
Figure 2: South Africa’s quarter-on-quarter real GDP Growth rates
Source: https://tradingeconomics.com
Figure 3: REPO Rates
Data Source: South African Reserve Bank
Figure 4: Inflation Rates
Data Source: South African Reserve Bank
Figure 5: ZAR/USD exchange rates
Data Source: South African Reserve Bank